Running srsgui application
Starting srsgui application
Following proper installation, you can launch the srsgui application by typing
one of the following commands into a command prompt.
If you installed it with a virtual environment, activate the virtual environment
before starting srsgui.
# If python/script directory is in PATH setting,
srsgui

# If not,
python -m srsgui
On initial launch, the GUI window will load the default example project, and look like this: image.
Selecting a configuration file
When the srsgui application starts it loads the last configuration file it used.
If you want to use a different project from the loaded one, you can choose another one
by selecting a configuration file with the .taskconfig extension from the File/Open menu.
Connecting instruments to use
To connect to a remote instrument, select the instrument from the Instruments menu. This will bring up a dialog box with connection options. Once an instrument is connected, the Instrument Info panel displays information about the instrument.
Instruments that will be used in a task must be connected before running the task.
Connection and disconnection to/from an instrument should be handled in the srsgui application
(or in the .taskconfig file, see here), and not from the task itself.
If you select a instrument that is already connected, it will ask if you want to disconnect the instrument.
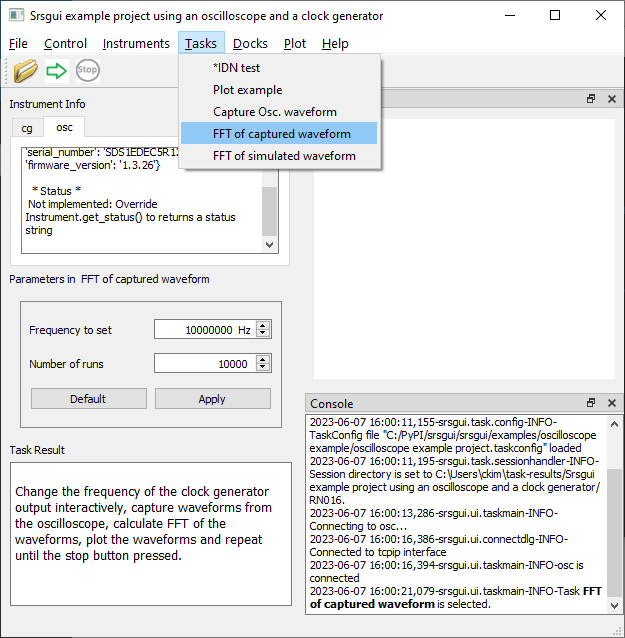
Running a task
You can choose a task to run from the Tasks menu. Once you select a task, the Parameters panel will display the parameters for the task, and the Task Result panel will display the description of the task (defined by the the class doc string).
Srsgui application with a floating (undocked) dock widget
After selecting the task you want to run, adjust the Parameters if necessary, and press the green arrow under the menu toolbar, or select Control/Run.
Stopping a running task
Srsgui application does not kill a running task. Instead, it sets a flag to indicate
the stop is requested. The running task should check the flag frequently, and stop at its earliest convenience.
Saving a data file
Every run of a task automatically generates a data file as %USERPROFILE%\task-results\the_name_in_taskconfig_file\RNxxx\task_name-timestamp.sgdata. Typically, the %USERPROFILE% directory is C:\users\your_user_name in Windows. It is the home directory, $HOME, in Linux.
A default instance of the class TaskResult is generated
after an instance of Task subclass and saved
as a Python dictionary in the data file.
A task can save additional Python dictionaries and create tables for large data sets in the default data file
using APIs in Task class.
Dock widgets in srsgui application
The Srsgui application is a Qt application built on QMainWindow for GUI.
Thanks to Python Qt binder, such as, Pyside6, we can write Python scripts using the Qt C++ library.
Srsgui extensively uses QDockWidget as a container for its widgets,
such as the console, the terminal, and the instrument capture.
By putting the widgets in QDockWidget, they can be
arranged however you want. Qt dock widgets can be docked anywhere
around the main window, stacked together with one another, closed, or floated (undocked)
outside the main window.
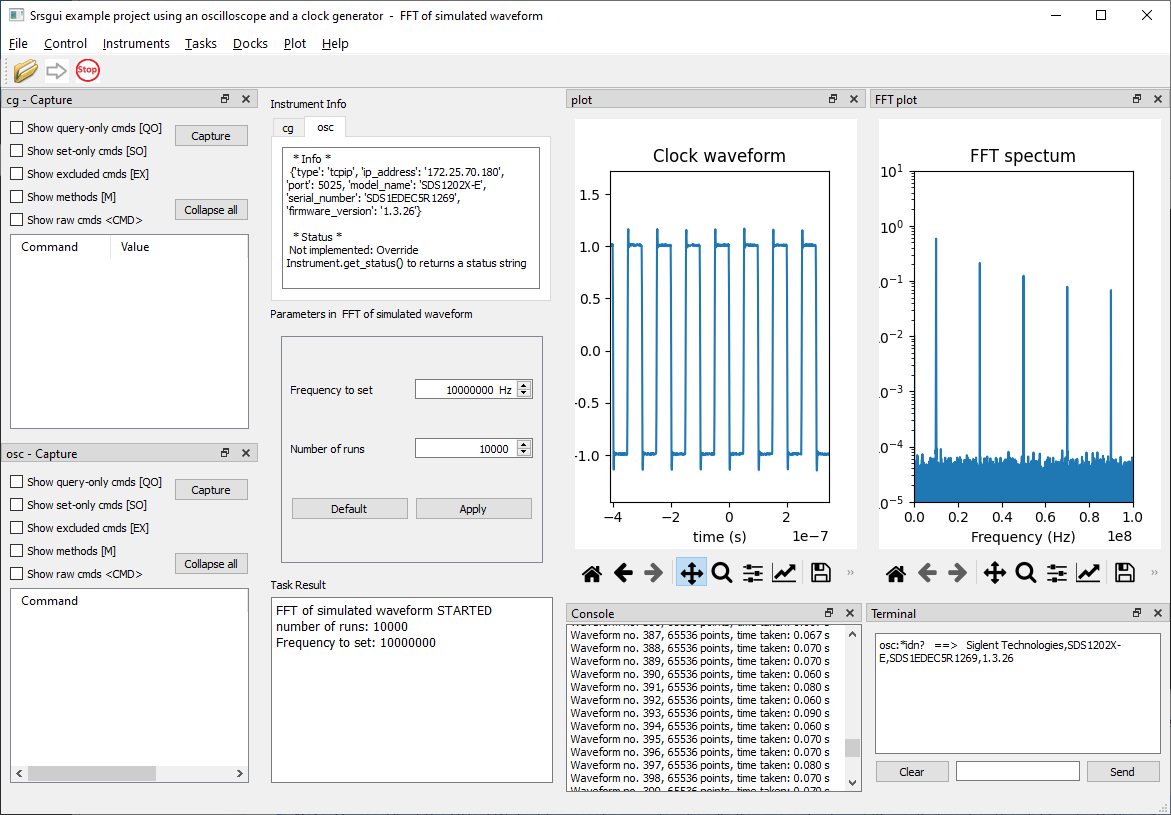
Srsgui application with dock widgets docked
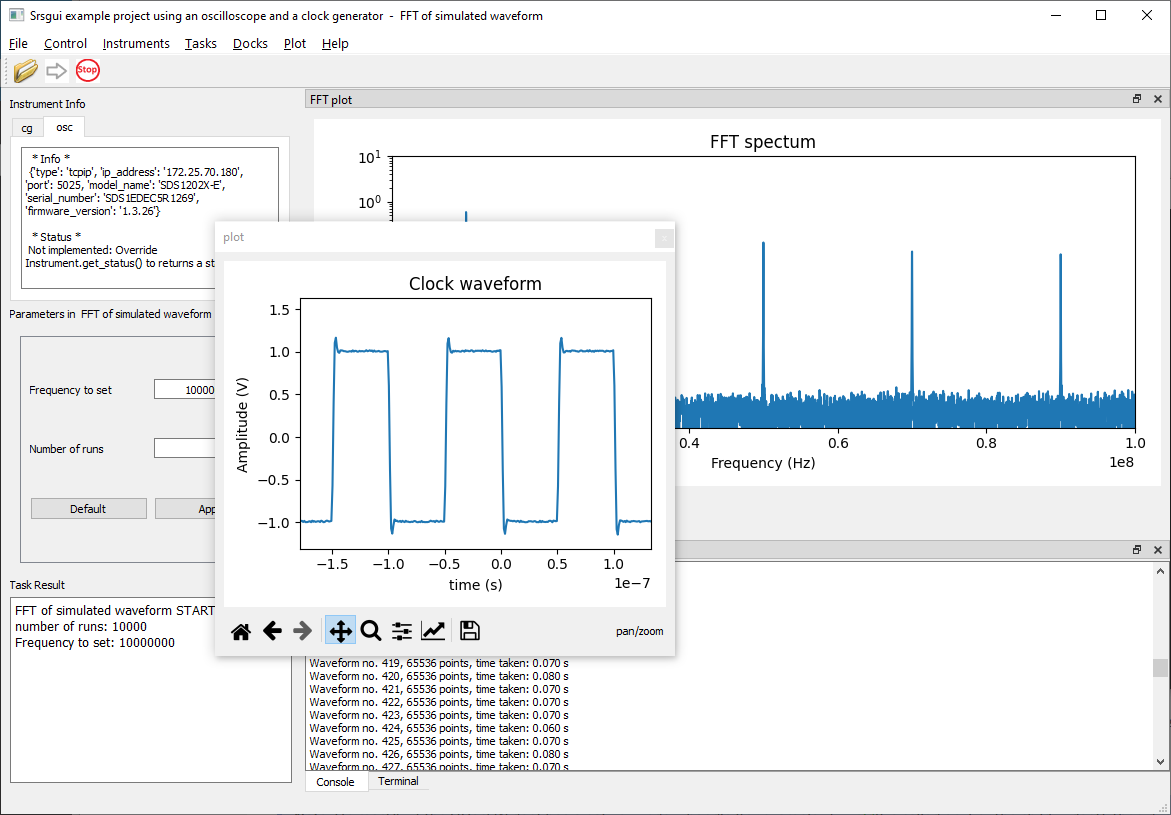
Srsgui application with a floating (undocked) dock widget
The other major GUI component is Matplotlib, the most popular Python data visualiation
library. By putting a Matplotlib Figure in a QDockWidget, srsgui provides
flexible layouts of multiple Matplotlib plots. Encapsulating Matplotlib Figure-handling
into the Task class makes it simple to use a
Matplotlib figure in Task subclasses.
When you choose a dock widget from the Docks menu, it will bring the dock widget to the top level, even if it was previously closed.
Capture dock widget
The capture dock widget is the latest addition to the srsgui application.
Each instrument in the configuration file will have its own capture dock widget.
You can open it by selecting the menu item named “instrument_name-capture” from the Docks menu.
The capture dock is used to provide an interactive snapshot of the instrument state
via a tree view of the Instrument class
and its multiple components,
commands and
index commands.
(This utilizes Qt Model/View programming.)
The capture dock captures the values of commands and
index commands
defined in an instrument class,
and allows you to change the values interactively.
Note
An active capture dock widget generates a lot of communication traffic to the physical instrument whenever it needs to update the item values. If the running task needs the full communication capacity, you can avoid the extra communication load and prevent interference with the task by closing the dock widget.
It can display optional insformation:
With Show query-only cmds option checked, commands that can be queried, but not set will be displayed with the [QO] tag after their command name, along with the query value.
With Show set-only cmds option checked, the name of commands that cannot be queried will be displayed with the [SO] tag after the command name.
With Show excluded cmds checked, the name of commands that are intentionally excluded will be displayed with the [EX] tag after the command name. The query return value will not be shown.
With Show methods checked, methods of the components of the instrument class will be displayed with the [M] tag after the command name. Simple methods that can run without parameters defined and do not return a value can be executed directly.
With Show raw cmds option checked, the raw remote command name associated with the item will be shown inside angle brackets, < >.
Capture dock widgets help you to understand the hierarchical structure of an instrument class and to use commands more easily in the command terminal or when writing task scripts in Python.
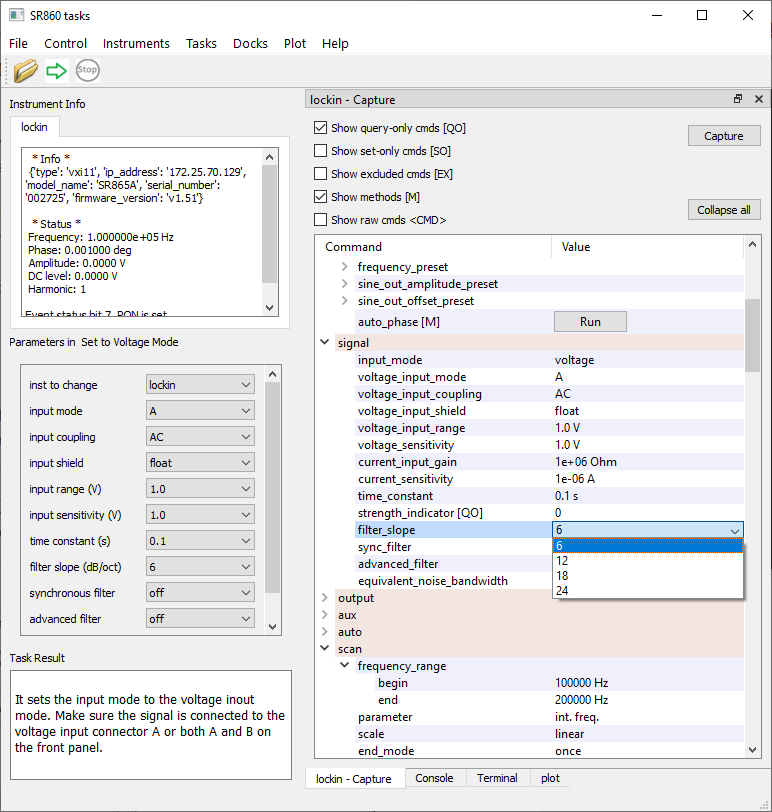
Screenshot of Capture dock widget of SR860 lock-in amplifier instrument class